Understanding & Reading Your Histogram
Do You Know How to Use Your Histogram Correctly?
Your camera’s histogram is a very useful tool to help get your exposures right ‘in camera’. But do you know how to use it correctly, or even what it actually does?
In this article, we’ll look at the histogram and how to use it to get perfectly exposed shots every time.
Why Use the Histogram and Not Your LCD Screen?
A common mistake made by photographers starting out with digital cameras is to evaluate the exposure by looking at the LCD screen. The trouble is that LCD screens have adjustable brightness, which you can set yourself and therefore the image you view bears no resemblance exposure-wise to your actual result.
LCD screens are useful to check your composition. You will obviously be able to tell if your exposure is massively under or over but, for an actual exposure result, you need to use your histogram.
What is a Histogram?
The dictionary definition of a histogram reads as follows:
‘A bar graph of a frequency distribution in which the width of the bars are proportional to the classes into which the variable has been divided and the heights of the bars are proportional to the class frequencies.’
If you’ve managed to read through that sentence, you’re probably more confused than ever! So, to put things more simply, a histogram is a graphical representation of the pixels exposed in your image.
The left-hand side of the graph represents your blacks and the right your whites. The middle section is your mid-tones (18% grey, which is exactly halfway between pure white and pure black). This is your primary histogram.
Some digital cameras also have colour histograms. They represent the red, blue and green-sensitive pixels on the sensor and relate to the RGB colour spectrum. But in this article, we’ll be looking at the primary histogram.
How to Use the Histogram
As we’ve already noted, the horizontal axis of your histogram goes from white through mid-grey to black, from right to left.
I often think that the vertical axis of the histogram looks a little like a mountain range, with peaks and troughs! Growth on the vertical axis actually indicates the relative quality of light for the given luminance. So, an image with a completely balanced exposure will show a ‘hump’ in the middle, which tailors off on each side towards black or white.
Digital cameras, if they use 8-bit sampling, have 255 shades of grey. So the histogram goes from 0 (black) to 255 (white). So the arches on your histogram essentially show the brightness of an image.
Overexposed Images
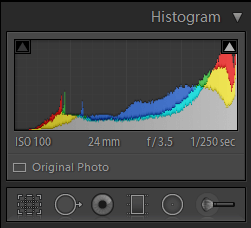
If you take a shot and see that the majority of your vertical arch is to the right of the image you will have a ‘high-key’ image, which could be overexposed.
Underexposed Images
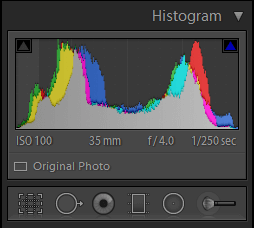
Reverse this so that most of your data is on the left and you’ll have a ‘low-key’ shot, which may be underexposed.

Getting It Right
Remember though that it’s not always a big fat negative to have a spike on one side of your histogram. For example, if you’re shooting with bright sunlight, it would be totally normal to see a sharp right-hand spike.
So, when you’re using the histogram you need to know three things:
- How to read the histogram
- What’s in your scene in terms of brightness, darkness and contrast,
- Your end ‘goal’ and desired result. A completely balanced histogram isn’t always the desired result but in a normal scene, it should be.
Once you’ve taken these three elements into account and understand how the histogram is working, you can then view it and make any adjustments you want. So, you can adjust your exposure by changing your aperture, shutter speed or ISO or even recompose your shot to change the amount of dark or light areas in your photo.
Clipping
To understand clipping, you need to understand the term dynamic range.
Dynamic range is defined as ‘the ratio between the maximum and minimum areas of luminance in a given scene’. If your camera is on automatic it will try to create an image that is exposed to capture the widest possible range of lights and darks. But, because dynamic range on a camera is limited, it will likely leave your image with blown-out highlights or pitch-black shadows. So, in relation to the histogram, if you have a spike touching the right edge of the histogram your camera is essentially saying that this area is so bright that it can’t tell if there is an object there.
Conversely, if you have a spike touching the left edge of the histogram you have shadow clipping. These dark areas are out of the camera’s dynamic range. Clipping means that you have a loss of data from these regions and no amount of post-production work will bring them back.
Whilst shadow clipping is pretty noticeable, it can be harder to see highlight clipping. Fortunately, most digital cameras have a flashing highlight indicator (known as the ‘blinkies’!) which causes the blown-out areas to ‘blink’. On some cameras, it will also indicate dark areas as well. Do note that clipping tends to be more prevalent in Jpegs. Rather shoot RAW where you can, as RAW files have a slightly greater dynamic range.
Adjusting Exposure In Lightroom
Lightroom has a built-in histogram as part of its basic editing panel. As soon as you bring an image into Lightroom, the first thing you should be doing is looking at the histogram. If you’ve shot in RAW you can easily adjust your exposure in Lightroom to create a more balanced histogram. In general, if your histogram is bunched up against the right-hand side it is overexposed. So move the exposure slider to the left to decrease exposure. If your histogram is bunched up on the left-hand side it is underexposed. Move the exposure slider to the right to increase exposure.
In Conclusion
Getting into the habit of using your histogram, and using it correctly, will really help improve your images. And it’s an easy way to check that you’ve got your exposure to your liking. Just remember that there’s no such thing as the ‘right’ histogram, and judge each shot on the effect that you want to achieve.
Video: Histograms
By Tony & Chelsea Northrup
In this video, Tony demonstrates exactly how to use the histogram.
Introducing PMM PRO
The only membership you need to grow your photography
Special Summer Deal... Our Biggest Sale For Photography Masterclass Magazine PRO
+ all the expertise you need in one place
+ step by step video lessons & comprehensive tutorials
+ curated photography for endless inspiration
+ Save 30% for life!
+ Unlock all magazine back issues (125+)
+ Access 3 premium guidebooks